
Security Platform
Security Platform
Critical alert response time from 60 sec → 9 sec
Enterprise Security


Timeframe
Timeframe
Jan- Aug 2024
Jan- Aug 2024
Industry
Industry
Enterprise Security
Enterprise Security
Role
Role
Product Designer
Product Designer
Note
Due to the proprietary nature of this enterprise security project and NDAs with Johnson Controls, I’m unable to showcase every detail of the work. However, I was a fully hands-on designer deeply involved in this platform's journey from initial research to launch. The artifacts and snippets I can share are intended to give you a transparent look into my process, my strategic thinking, and the impactful solution we delivered for JCI operators.
Introduction
Johnson Controls (JCI) operates critical infrastructure security systems across global retail and enterprise environments. Due to years of acquisitions, the platform ecosystem had fragmented into disconnected legacy tools, creating operational risk during active security incidents.
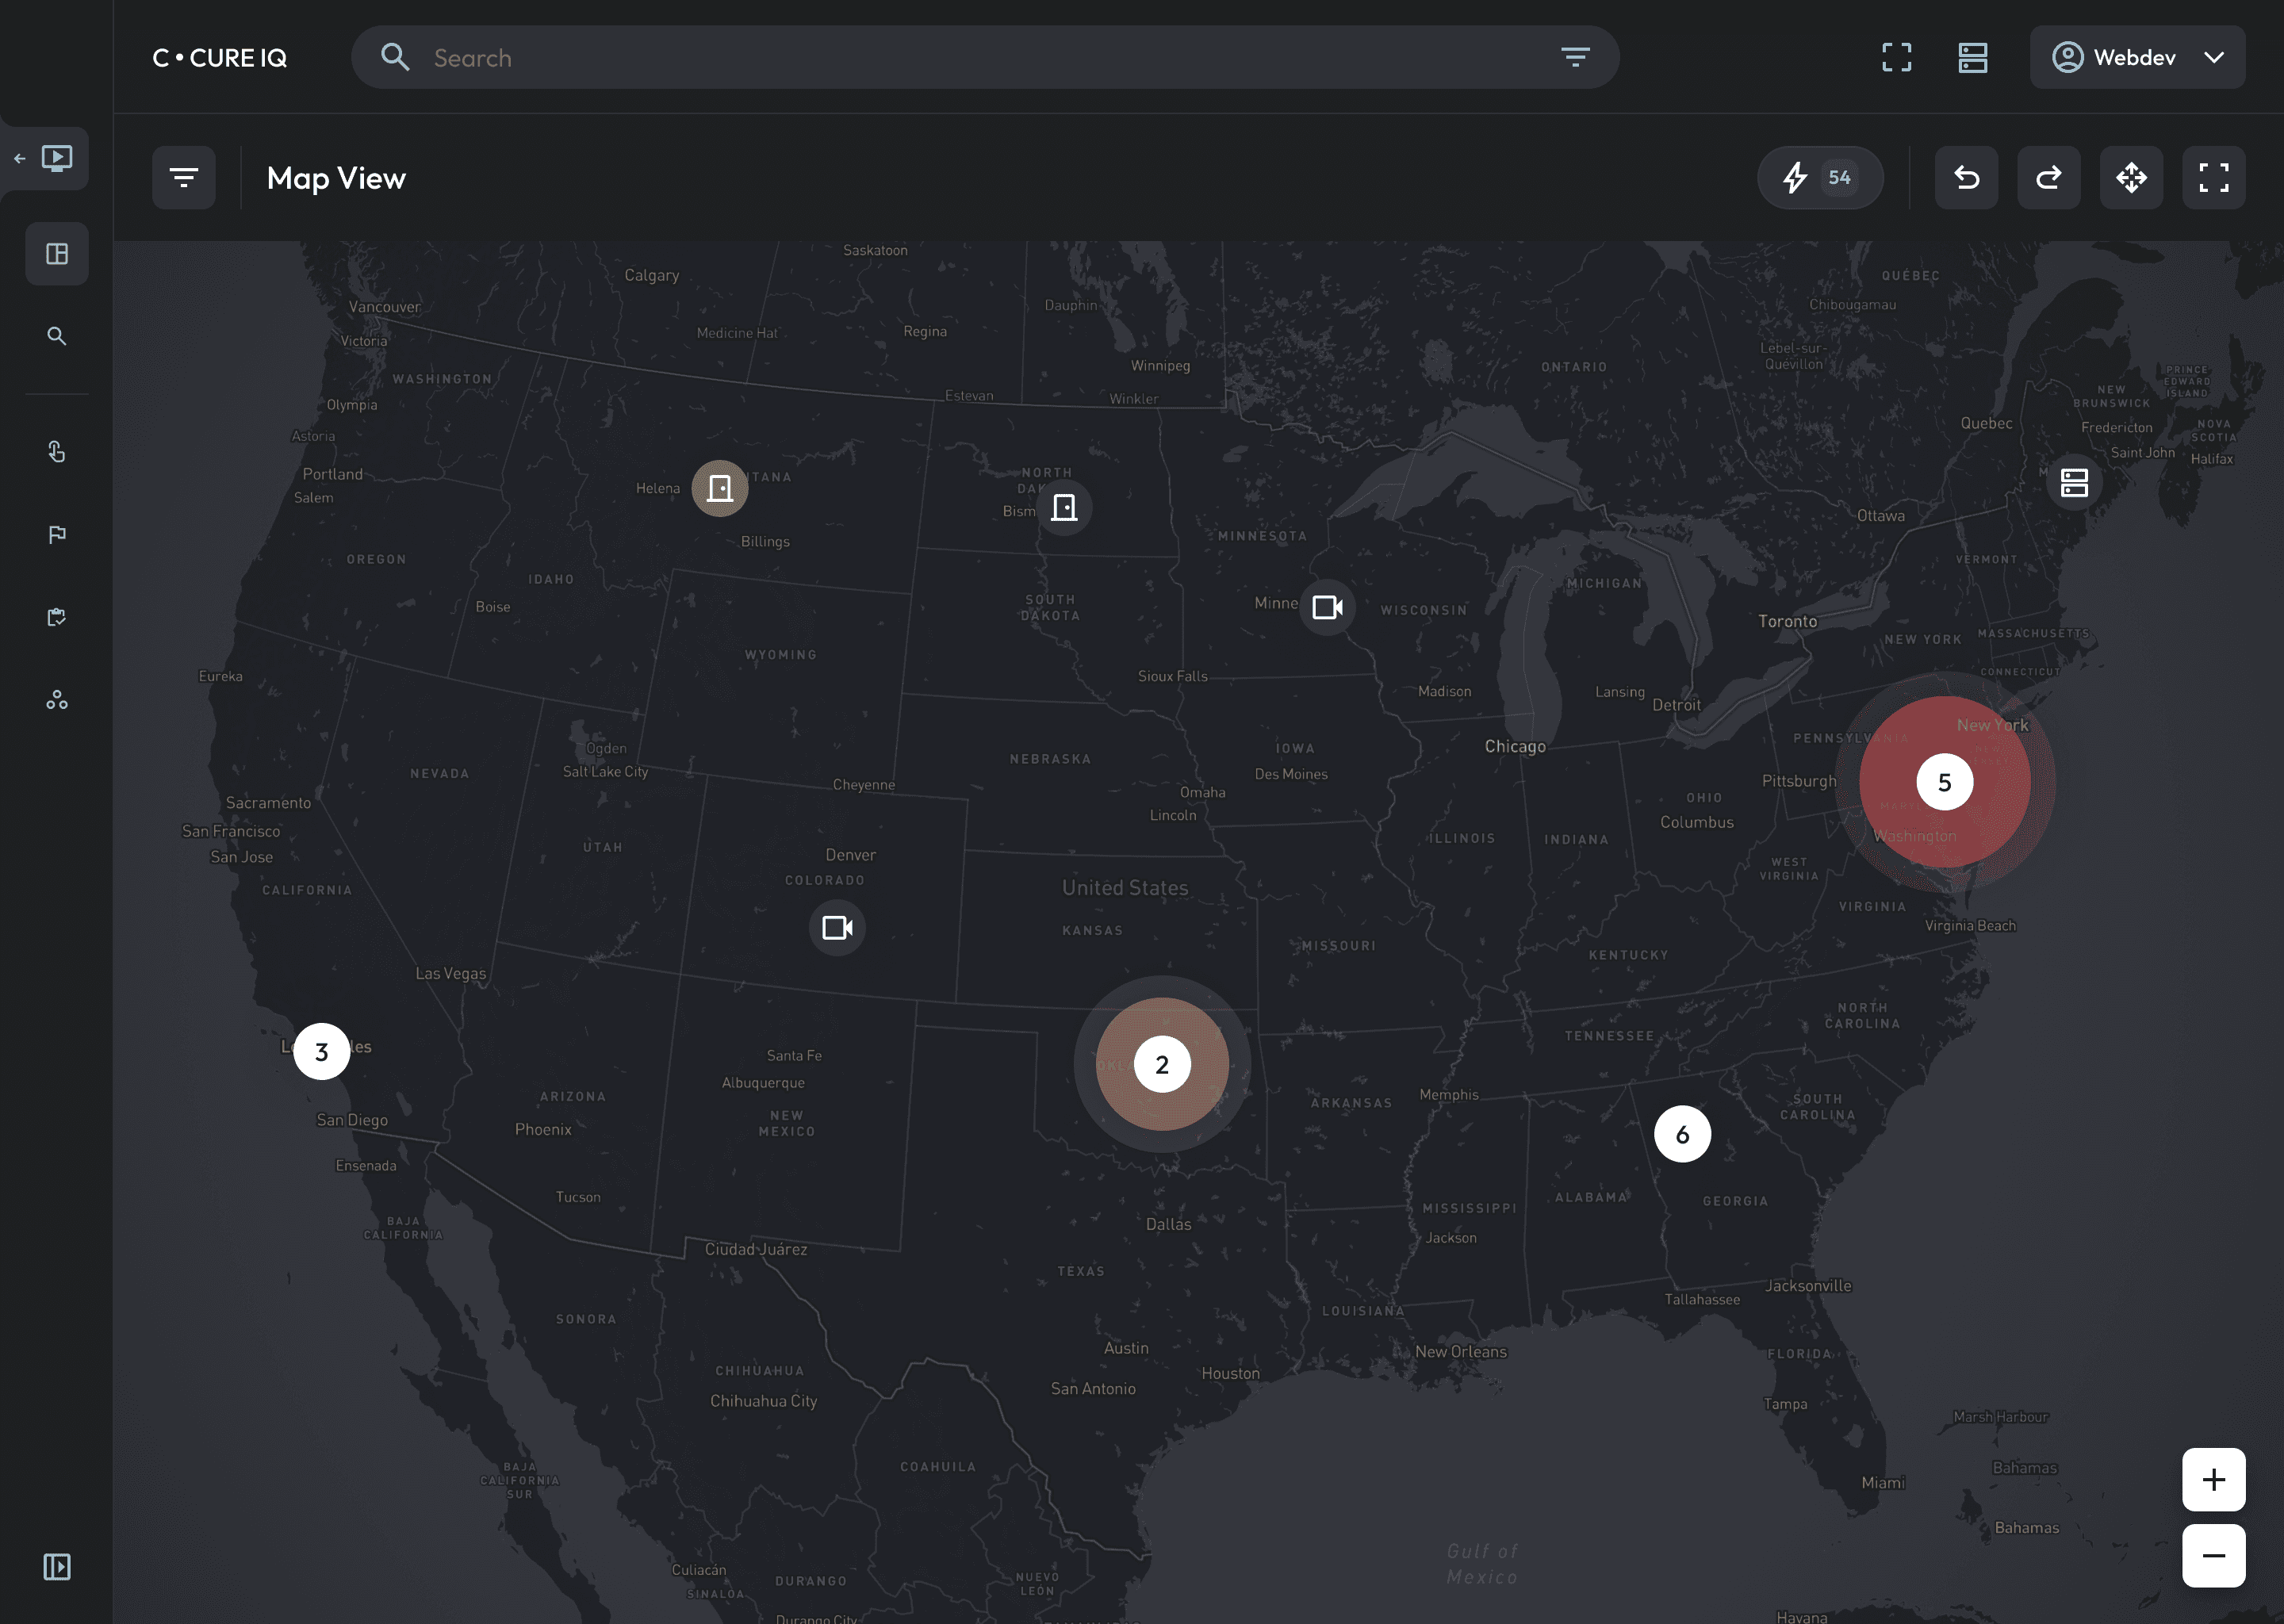
As Product Designer I led the design for the Map Module within One Security Platform (OSP), I owned the design of the system’s core spatial interaction layer the surface operators rely on to locate, assess, and respond to threats in real time.
By redefining the map from a reference tool into a primary command interface, the module reduced critical alert response time from 60 seconds to 9 seconds (91% reduction) and became a foundational interaction model for the broader platform.
Role: Product Designer
Scope: Systems mapping, interaction architecture, UAT leadership for spatial workflows
Primary Outcome: 91% reduction in time-to-action during security incidents
Problem
Security operators were forced to act as the integration layer between disconnected systems.
Handling a single alert required:
Pivoting between multiple applications
Manually locating cameras, doors, and personnel
Reconstructing context under time pressure
Our research showed this wasn’t just inefficient it introduced real operational risk.
>60 Secs


was lost locating the correct camera.
5+ Clicks
were required to navigate from a alert to its indoor map.
~35%
of non-critical alerts were mistakenly escalated.
>60 Secs
>60 Secs
was lost locating the correct camera.
was lost locating the correct camera.
5+ Clicks
5+ Clicks
were required to navigate from a alert to its indoor map.
were required to navigate from a alert to its indoor map.
~35%
~35%
of non-critical alerts were mistakenly escalated.
of non-critical alerts were mistakenly escalated.
A cosmetic redesign would not solve this.
The architecture of the experience was broken.
This data proved the system's foundation was broken.

Research
Mapping the Systemic Failure
To understand the scale of fragmentation, I collaborated in cross-functional workshops to map the full JCI ecosystem. We audited 200+ configuration and monitoring flows across legacy products and visualized them in a shared Miro board.
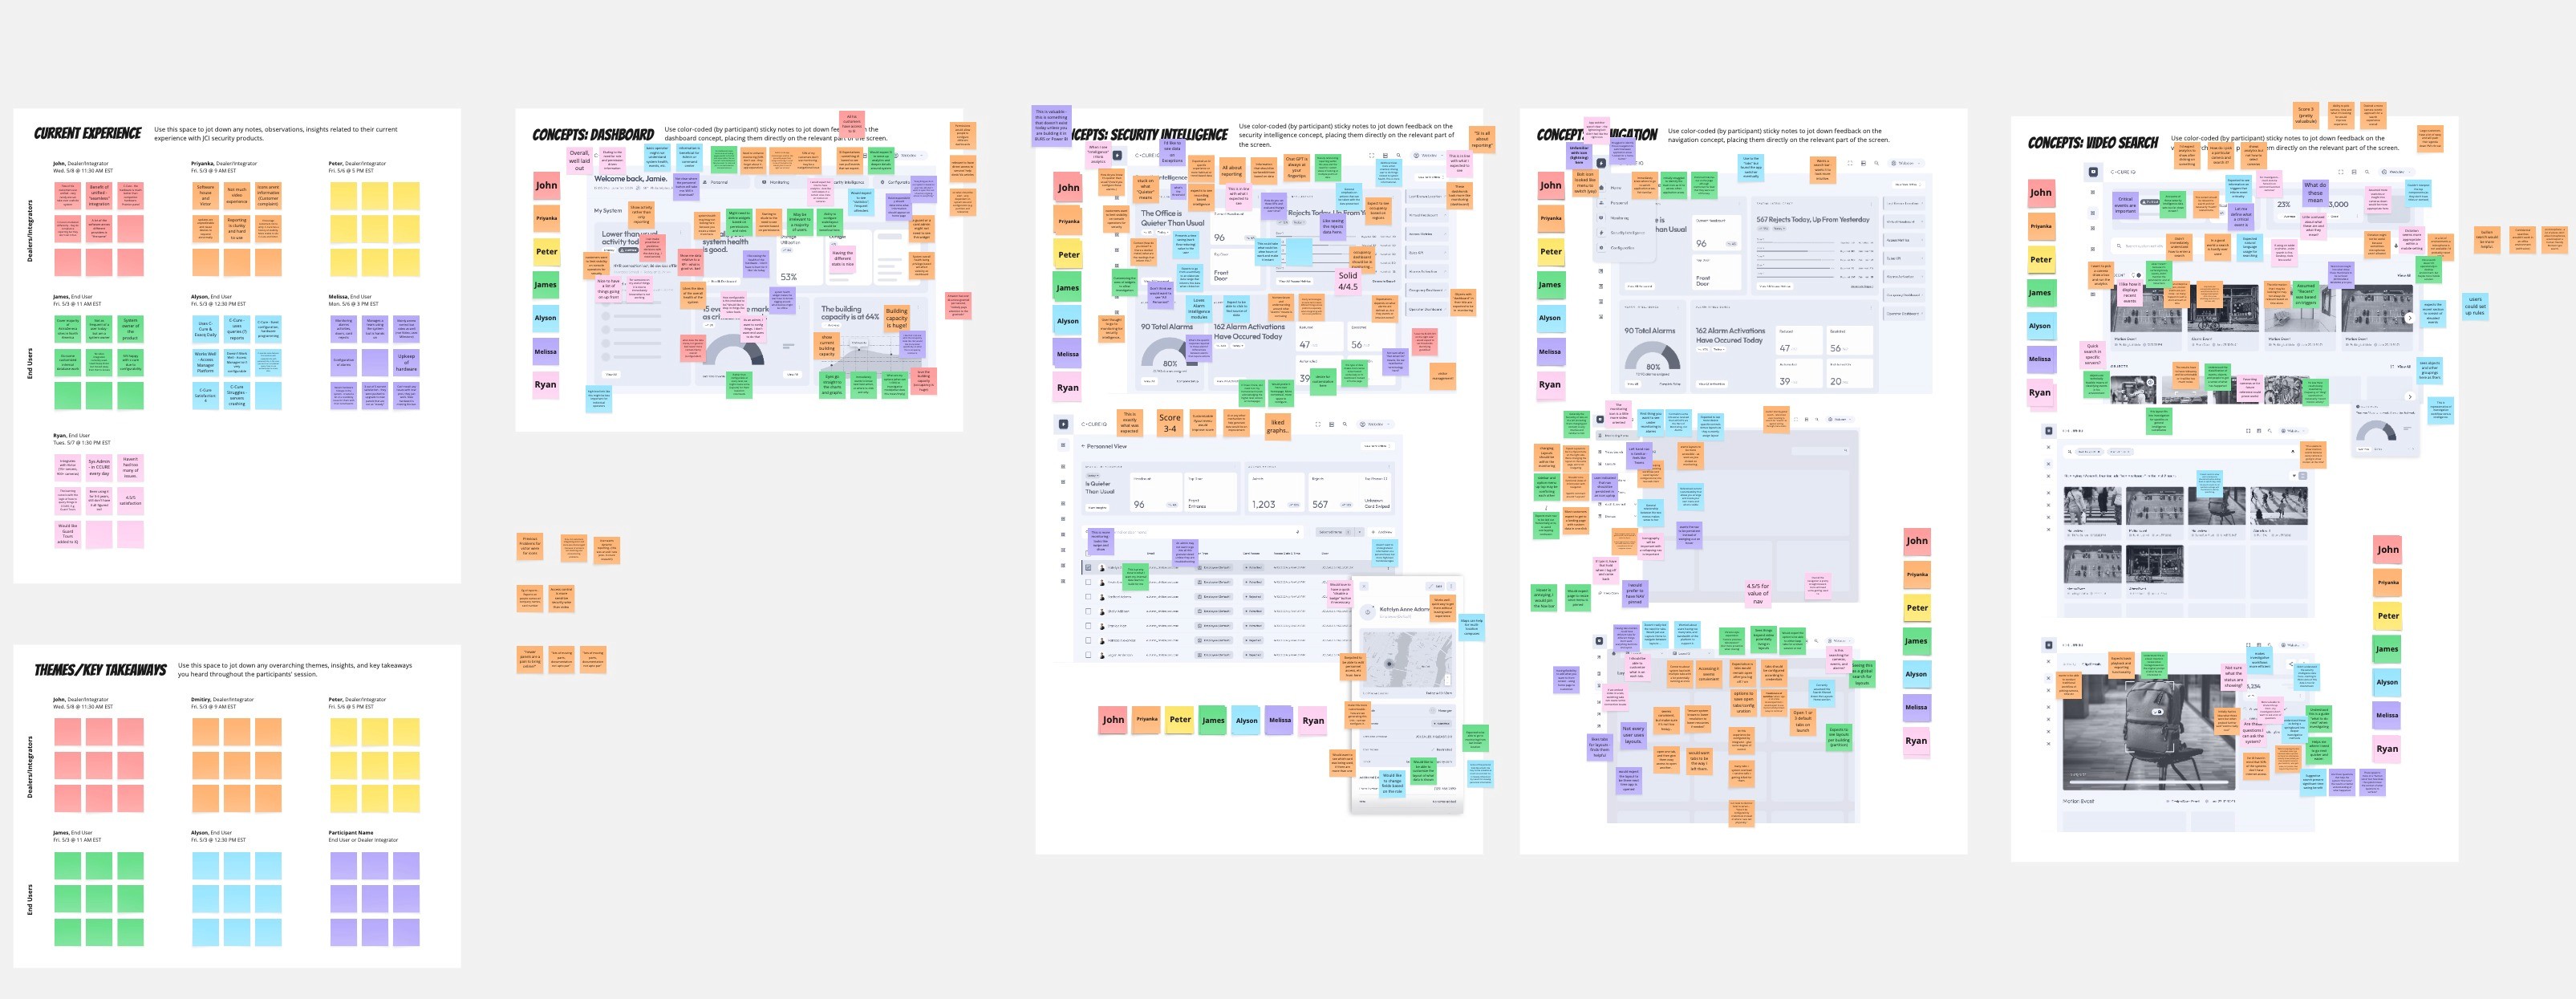
This artifact internally referred to as the system mapping became the foundation for alignment across design, product, and engineering.
What it revealed:
Redundant workflows solving the same problems differently
Conflicting mental models across products
Operators forced to maintain spatial context in memory, not the system
Competitive & Analogous Research
Rather than limiting analysis to security competitors, we studied:
Enterprise security platforms for alert handling patterns
Geospatial tools for spatial continuity
High-stakes real-time systems (e.g., telemetry dashboards) to understand how critical data is surfaced without overwhelming users
This research reinforced a key gap: none of the legacy systems treated spatial context as a first-class citizen.
Insight
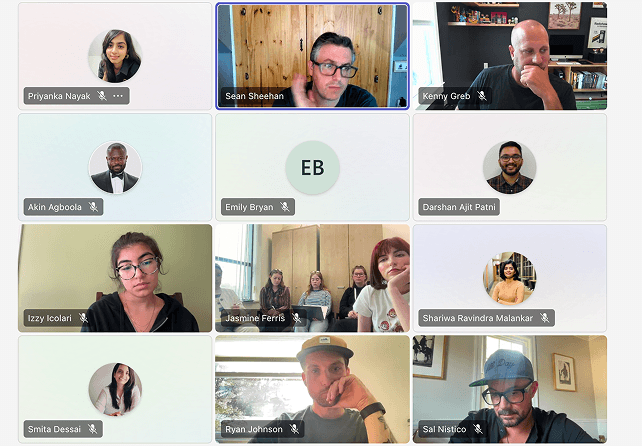
Through direct research with operators, particularly in a Boston security operations center, one insight consistently emerged:
"I don’t care where the event came from, I just need to see it, and see it on the map."
This became our architectural principle:
The map is not a feature. It is the interface.
Instead of modular tools stitched together, the platform needed a single contextual canvas that unified alerts, video, devices, and configuration in place.
Ideation
Early exploration included a widget-based dashboard approach. On paper, it appeared efficient. In practice, it failed to address the core issue; it simply compressed fragmentation onto one screen.
Through low-fidelity sketching and concept validation, we tested multiple directions and deliberately discarded the dashboard model.
Strategic Pivot
We committed to a map-centric architecture, using it as a ruthless prioritization filter:
If a feature didn’t surface context spatially, it didn’t belong in the MVP.
Separate “modules” were replaced with contextual overlays and tools that appeared in place.
To align engineering and leadership, I helped present a high-fidelity vision prototype demonstrating that a map-based UI could scale to 10,000+ sensors without performance degradation.
This secured buy-in for the architectural shift.
Roadmap Prioritization: We then used a prioritization matrix (Impact vs. Readiness) to strategically align engineering efforts.
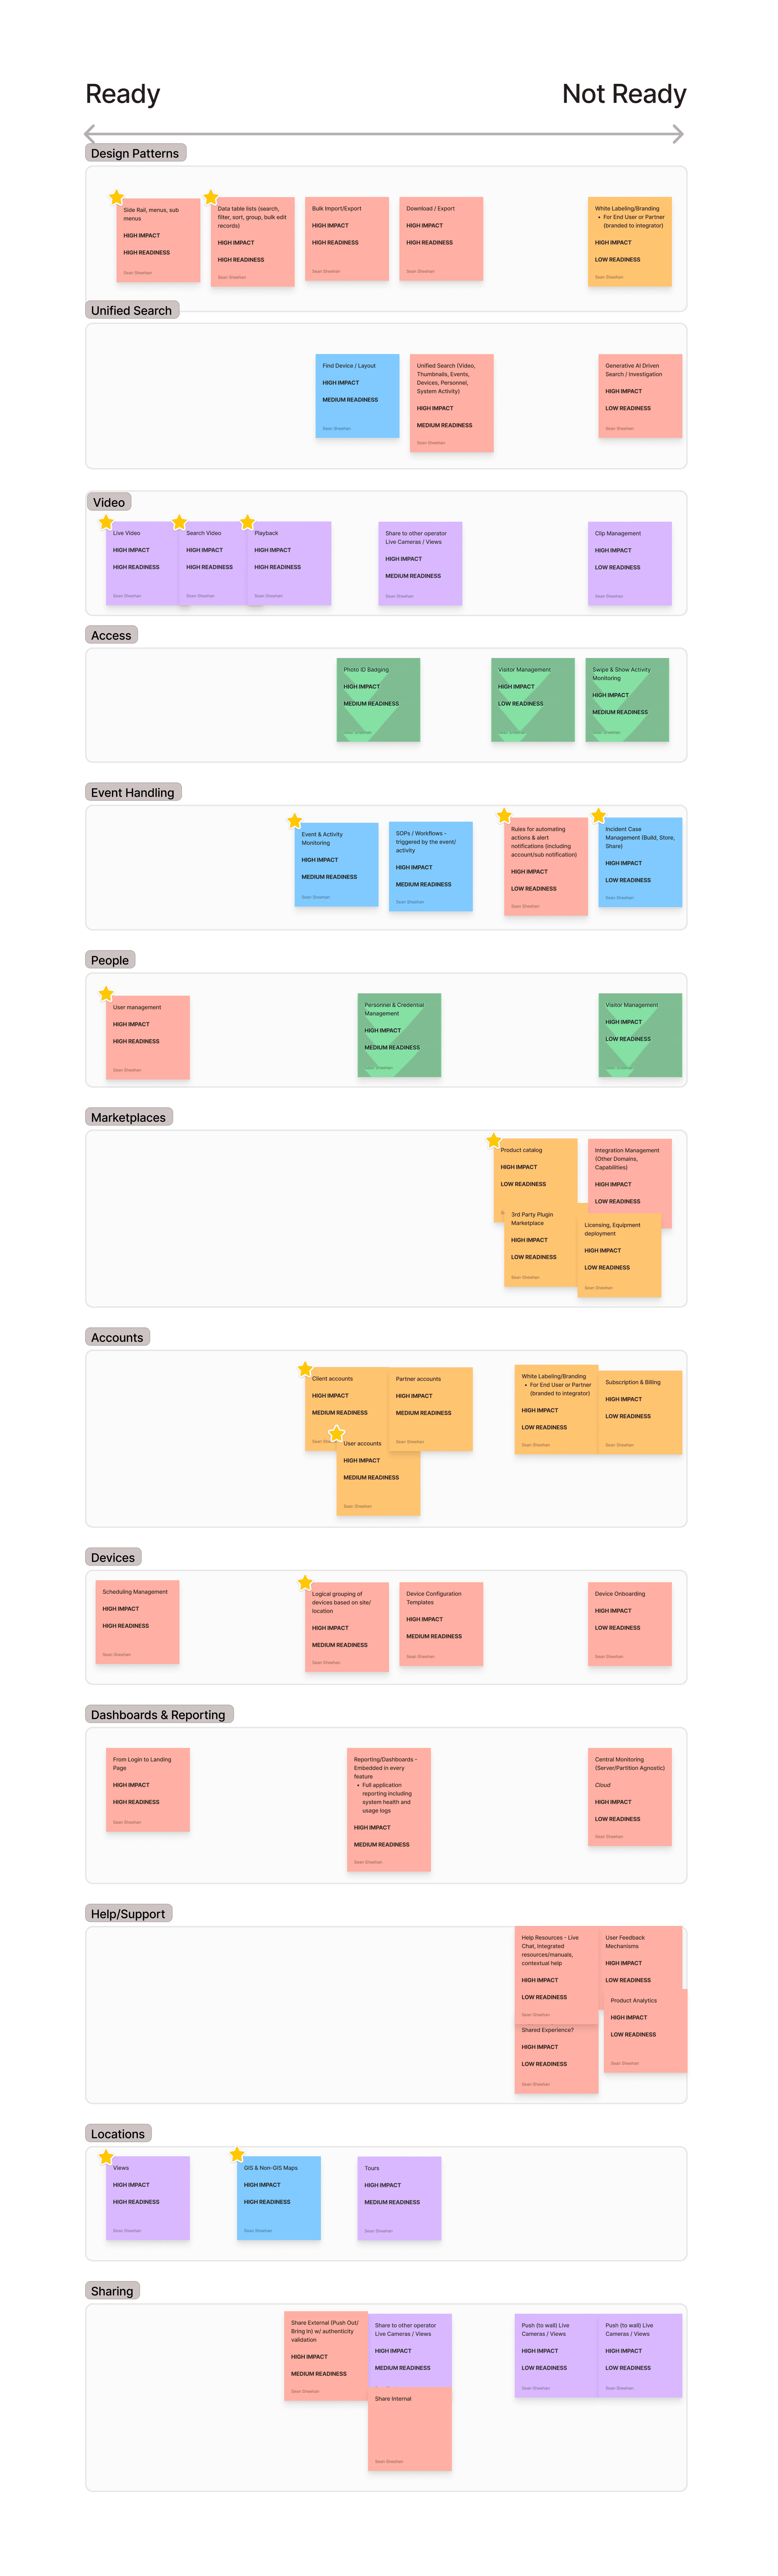
This strategic exercise confirmed the map-centric alerting and core unification workflows were the most critical features for the MVP.
Solution
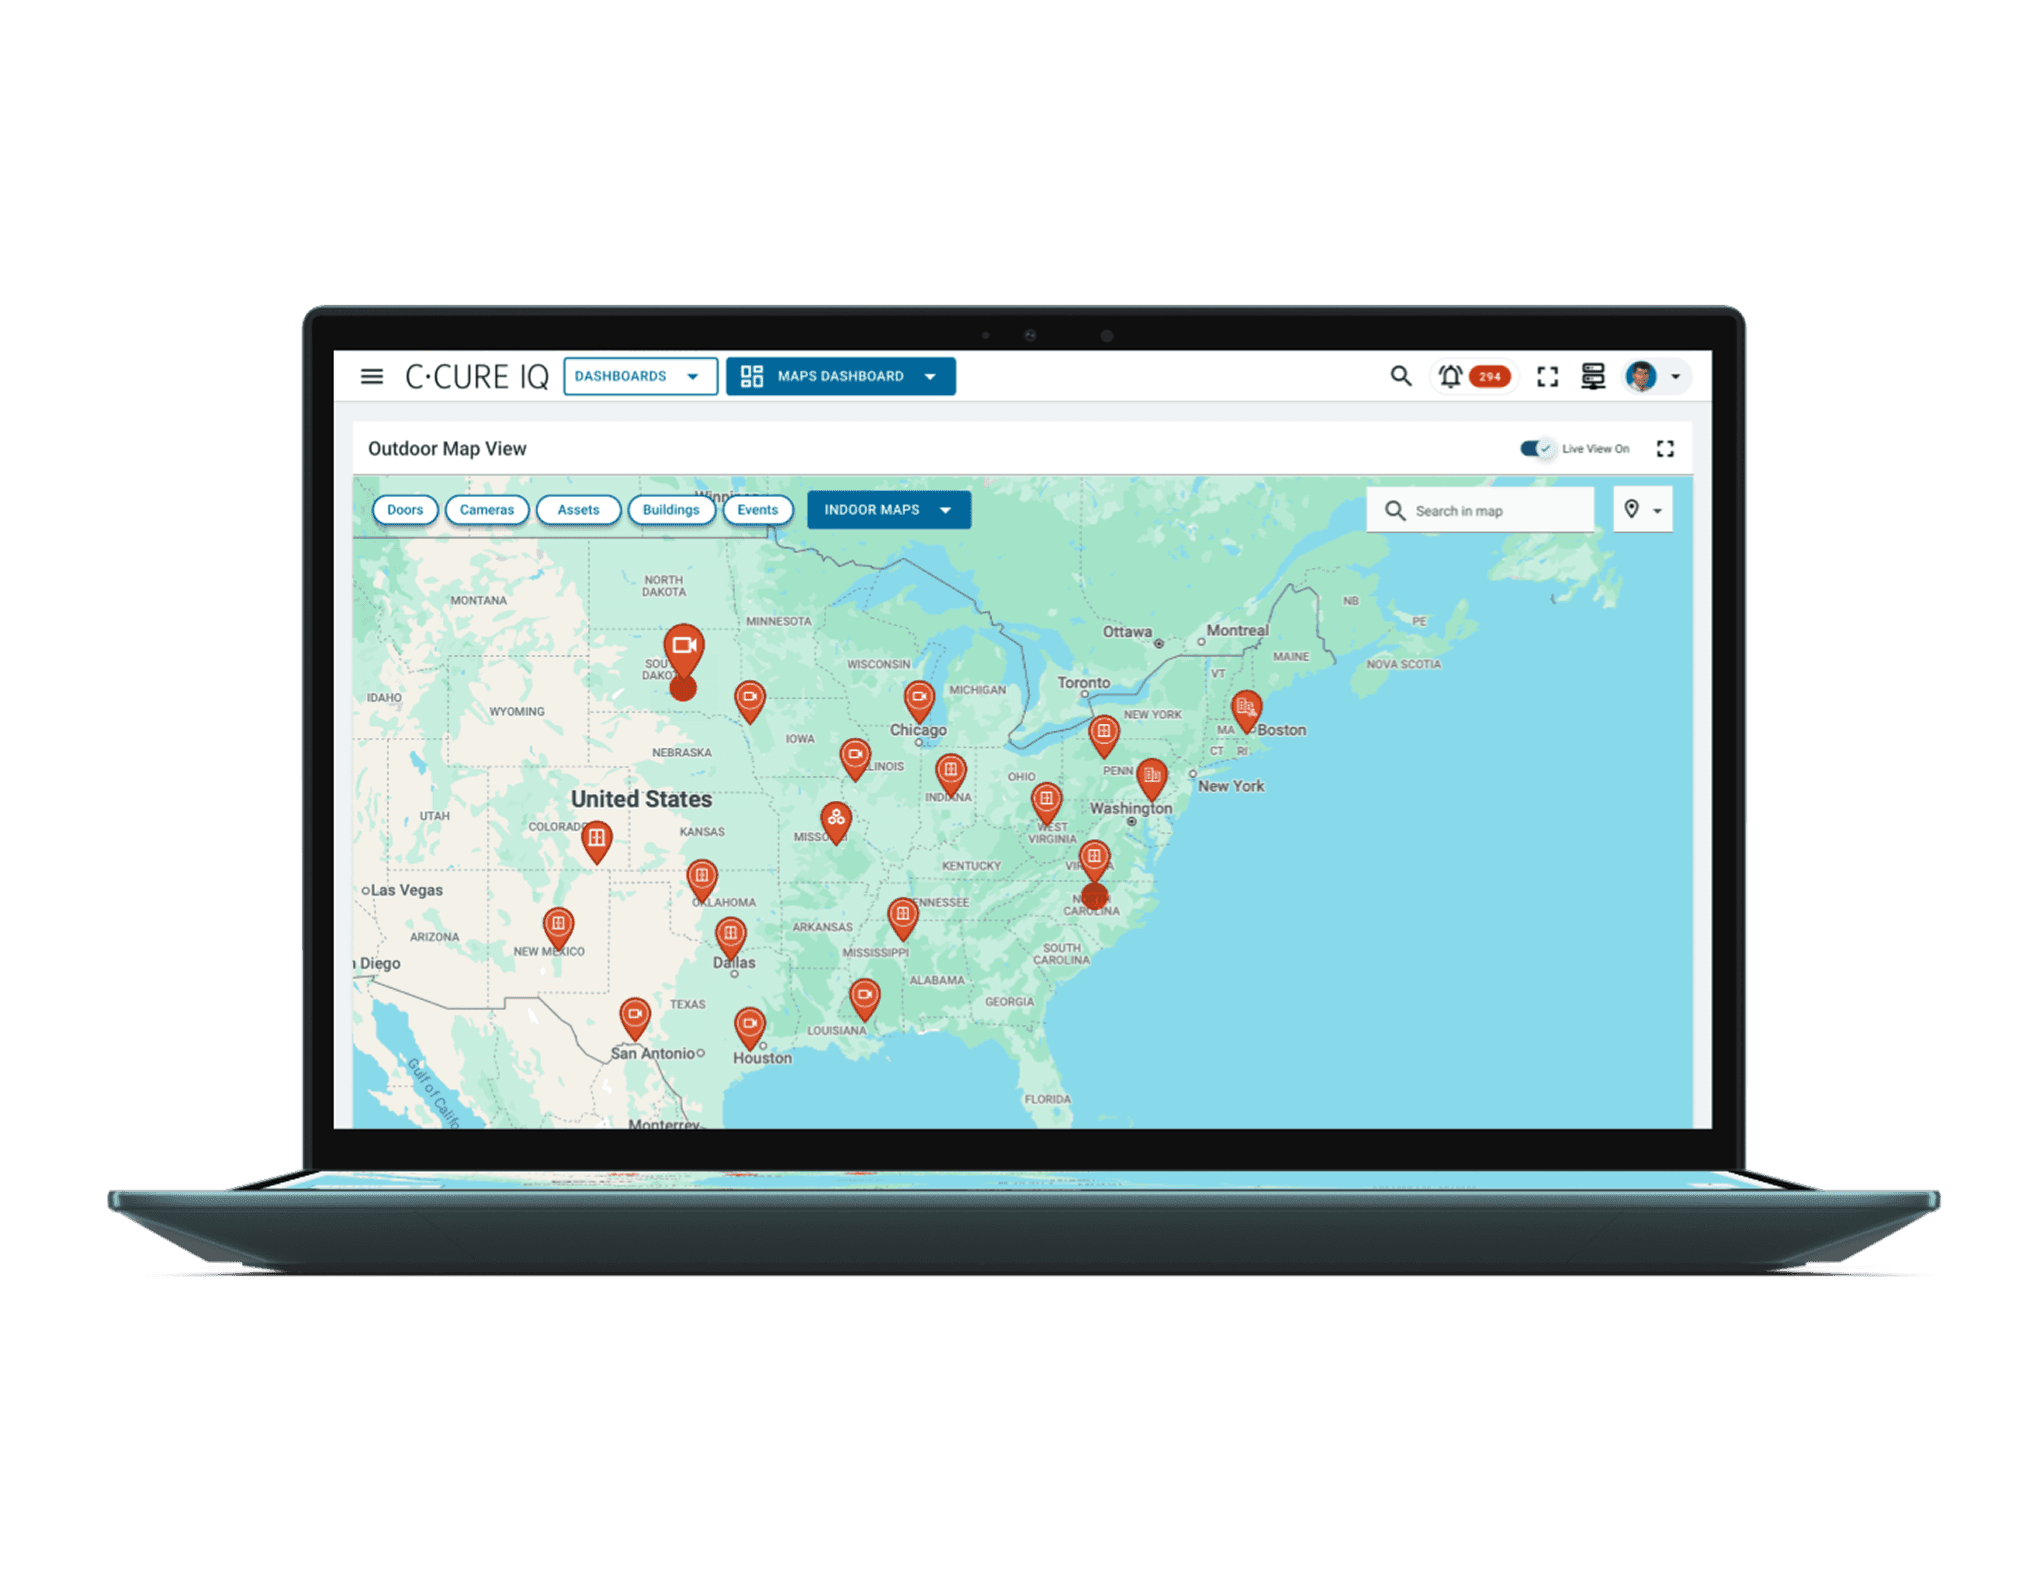
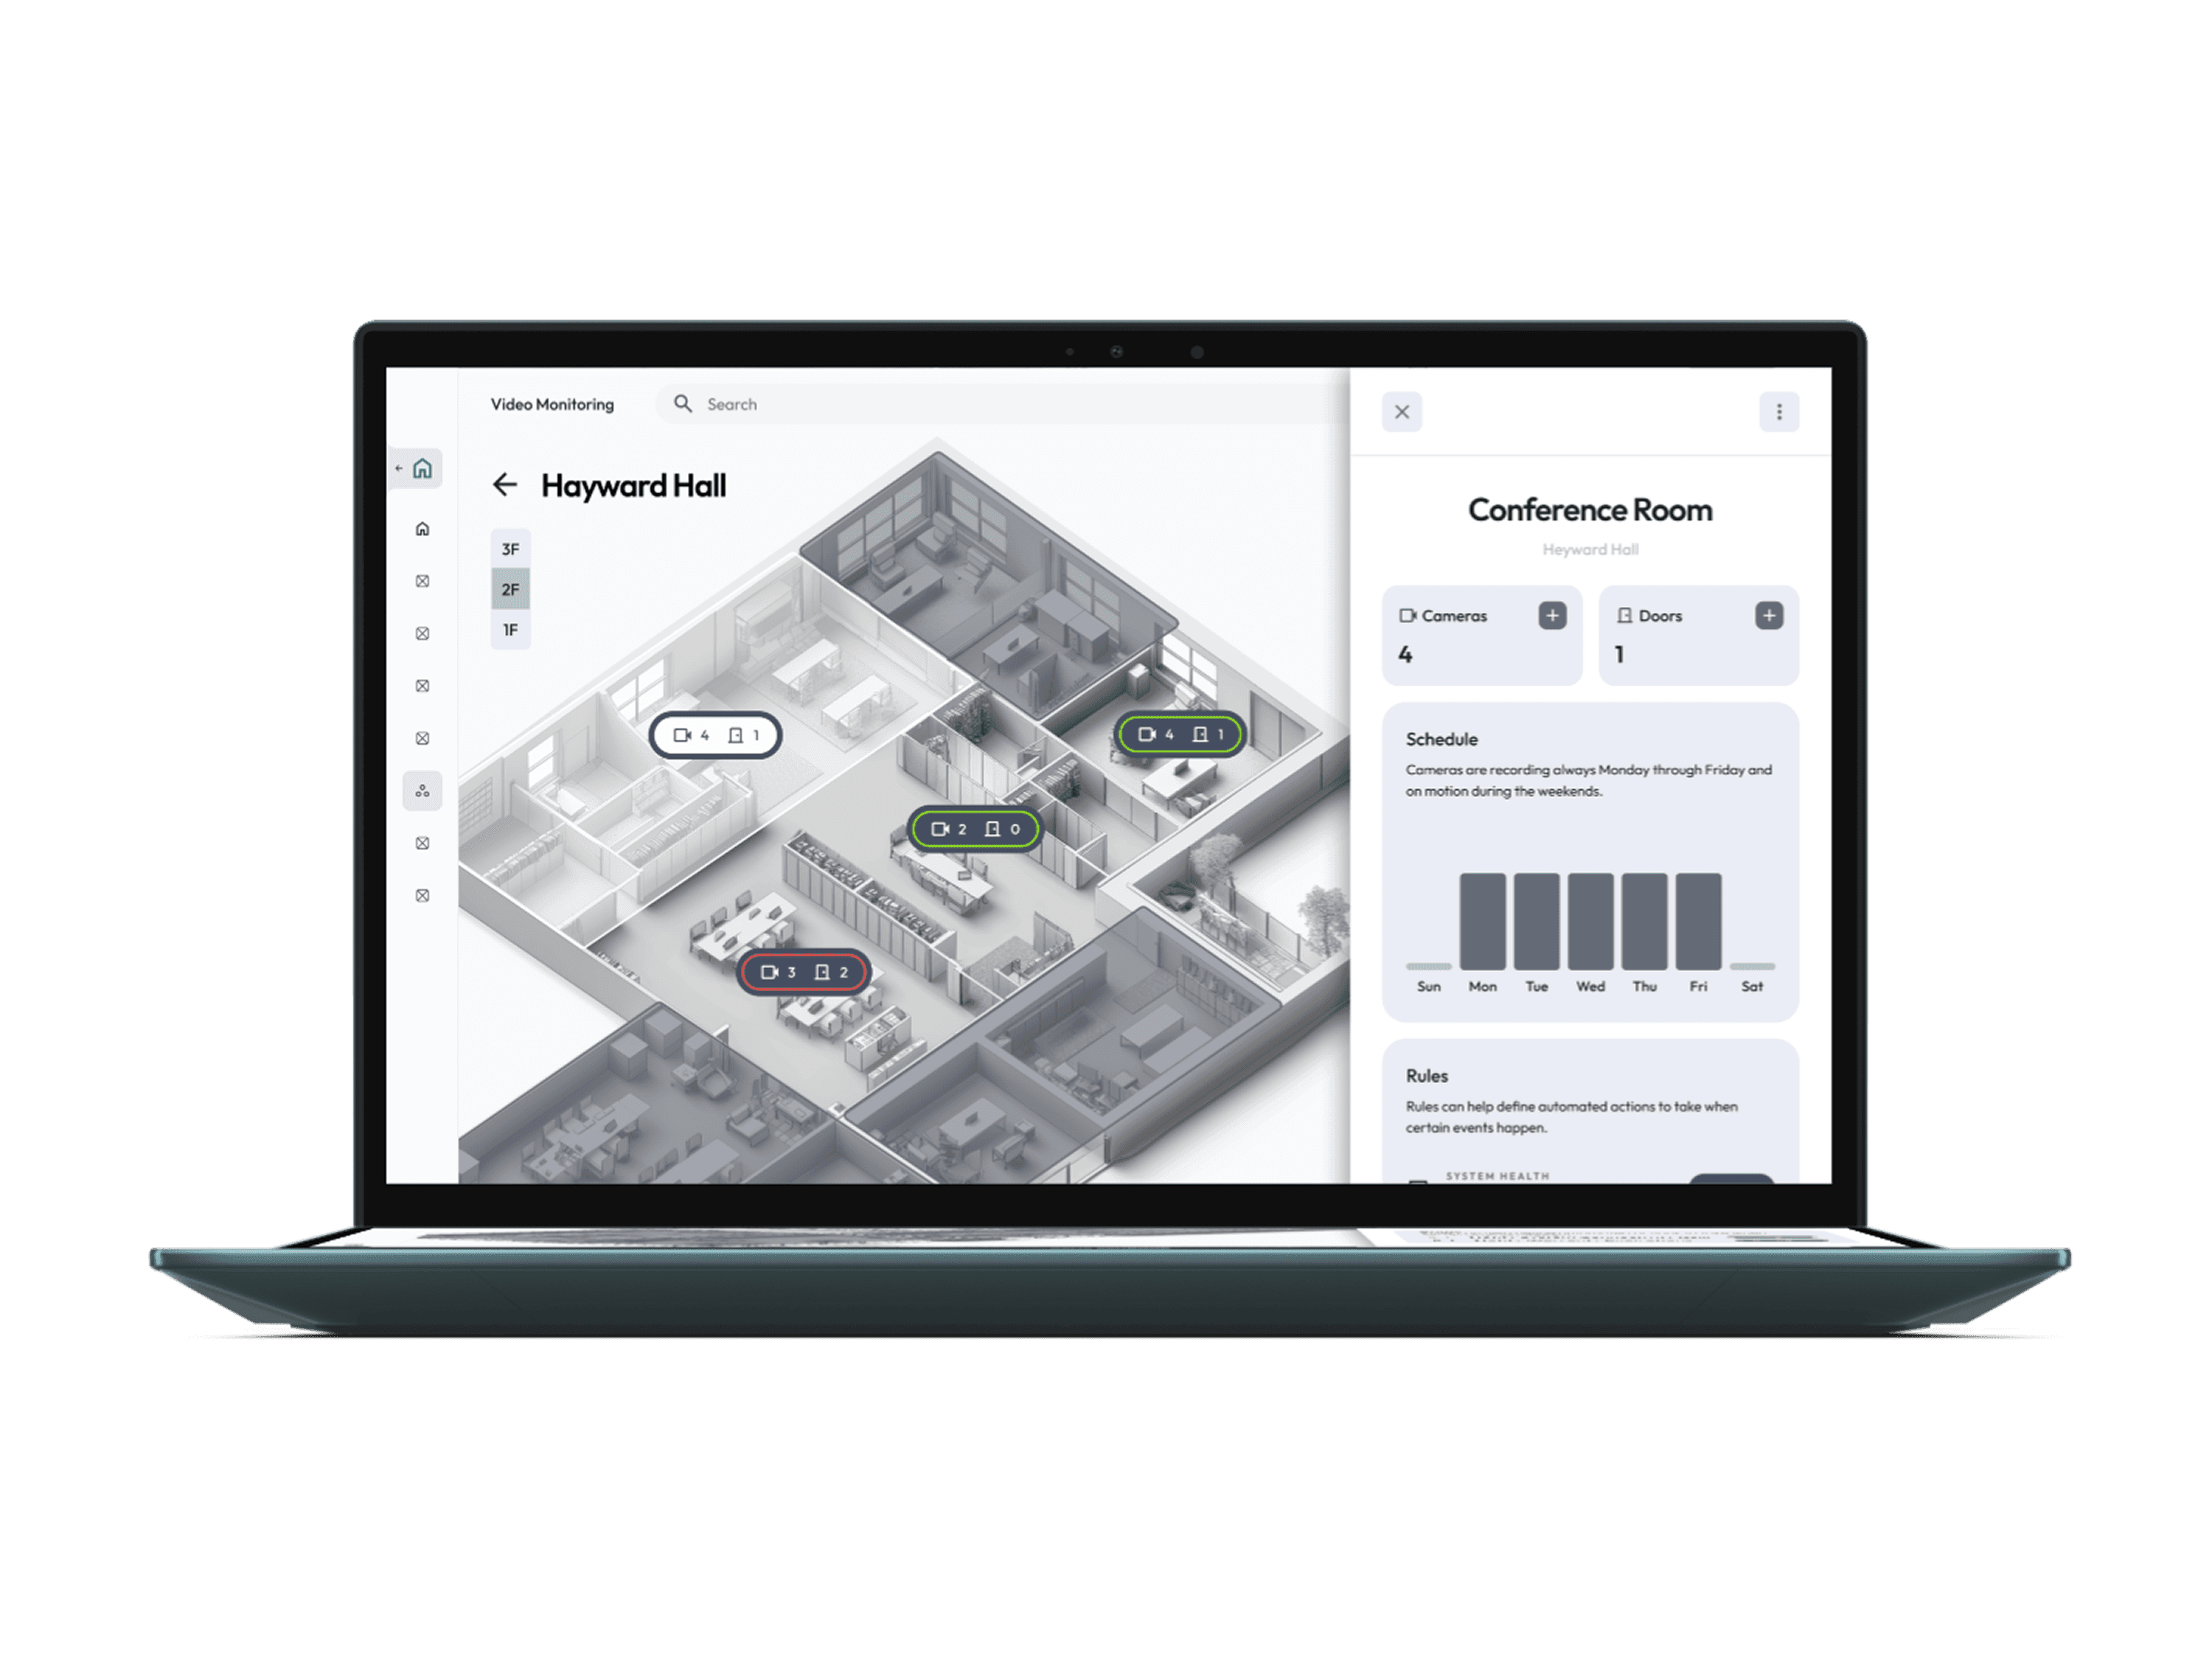
The Unified Command Interface
OSP launched as a single operational canvas where monitoring, alerting, video, and configuration coexist spatially.
Before
Before
After
After
Contextual Alert Handling
Alerts auto-focus the map to the precise location
Relevant camera feeds appear instantly via picture-in-picture
Operators no longer search for context—it is delivered
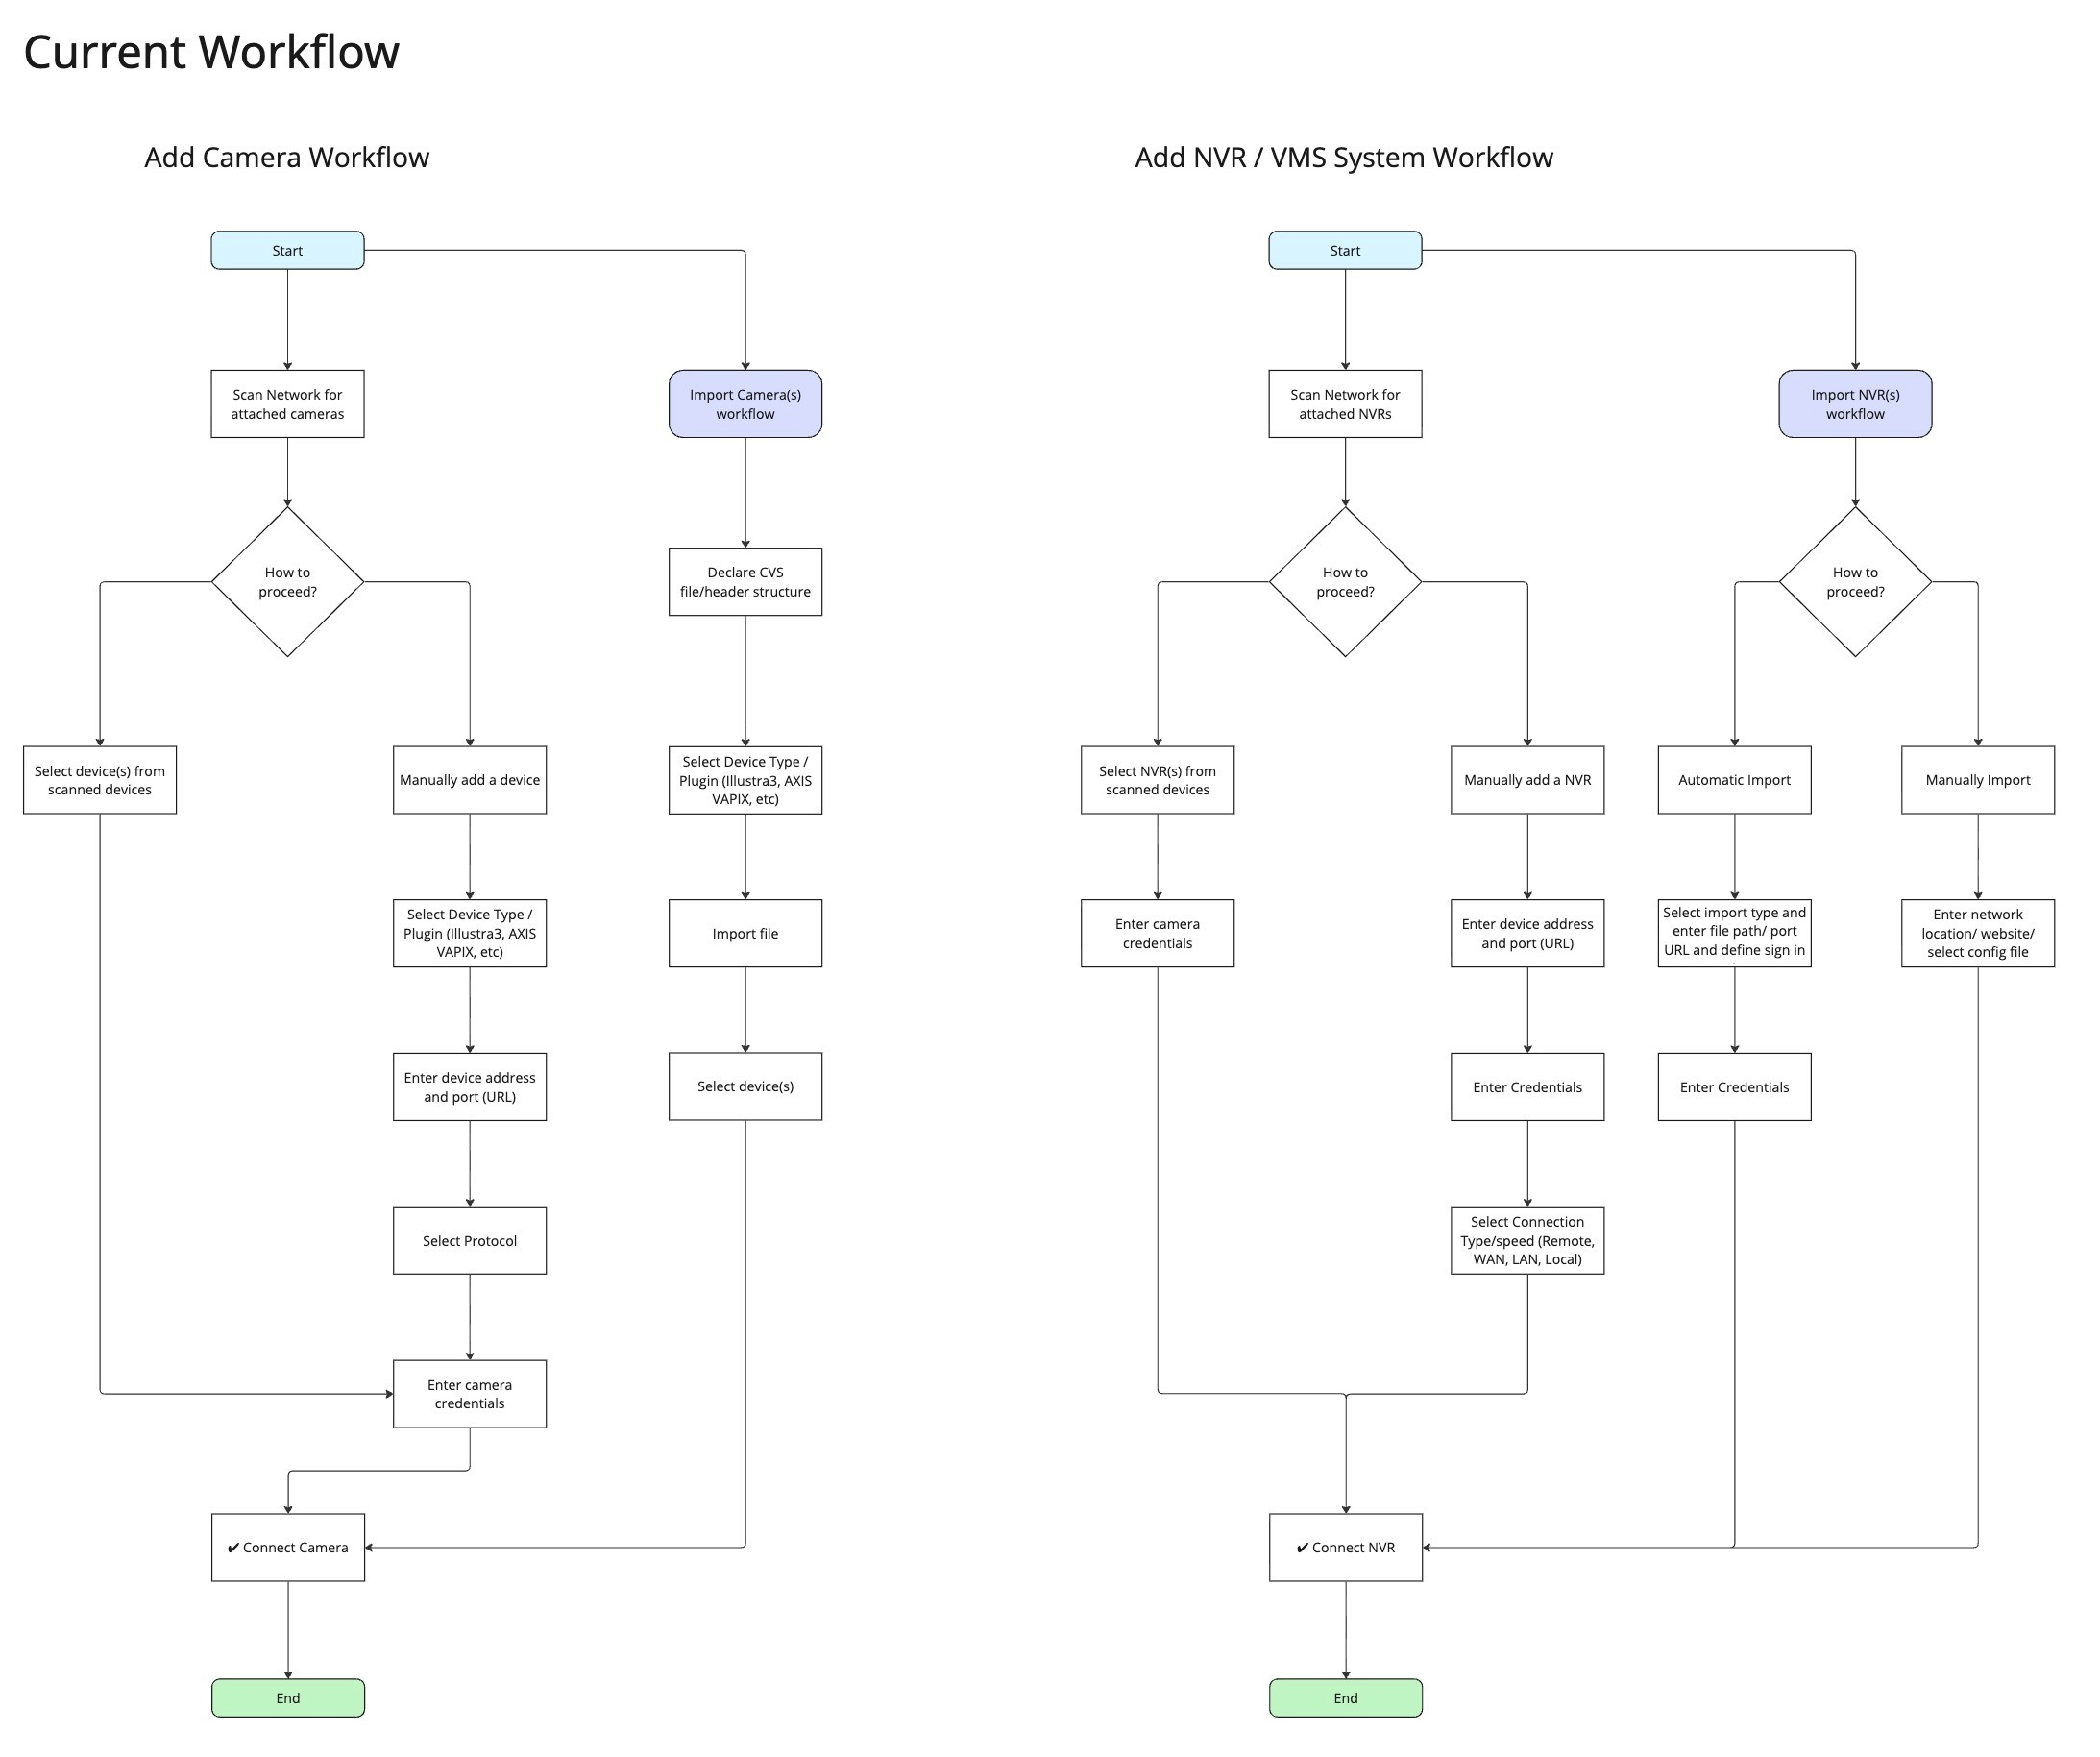
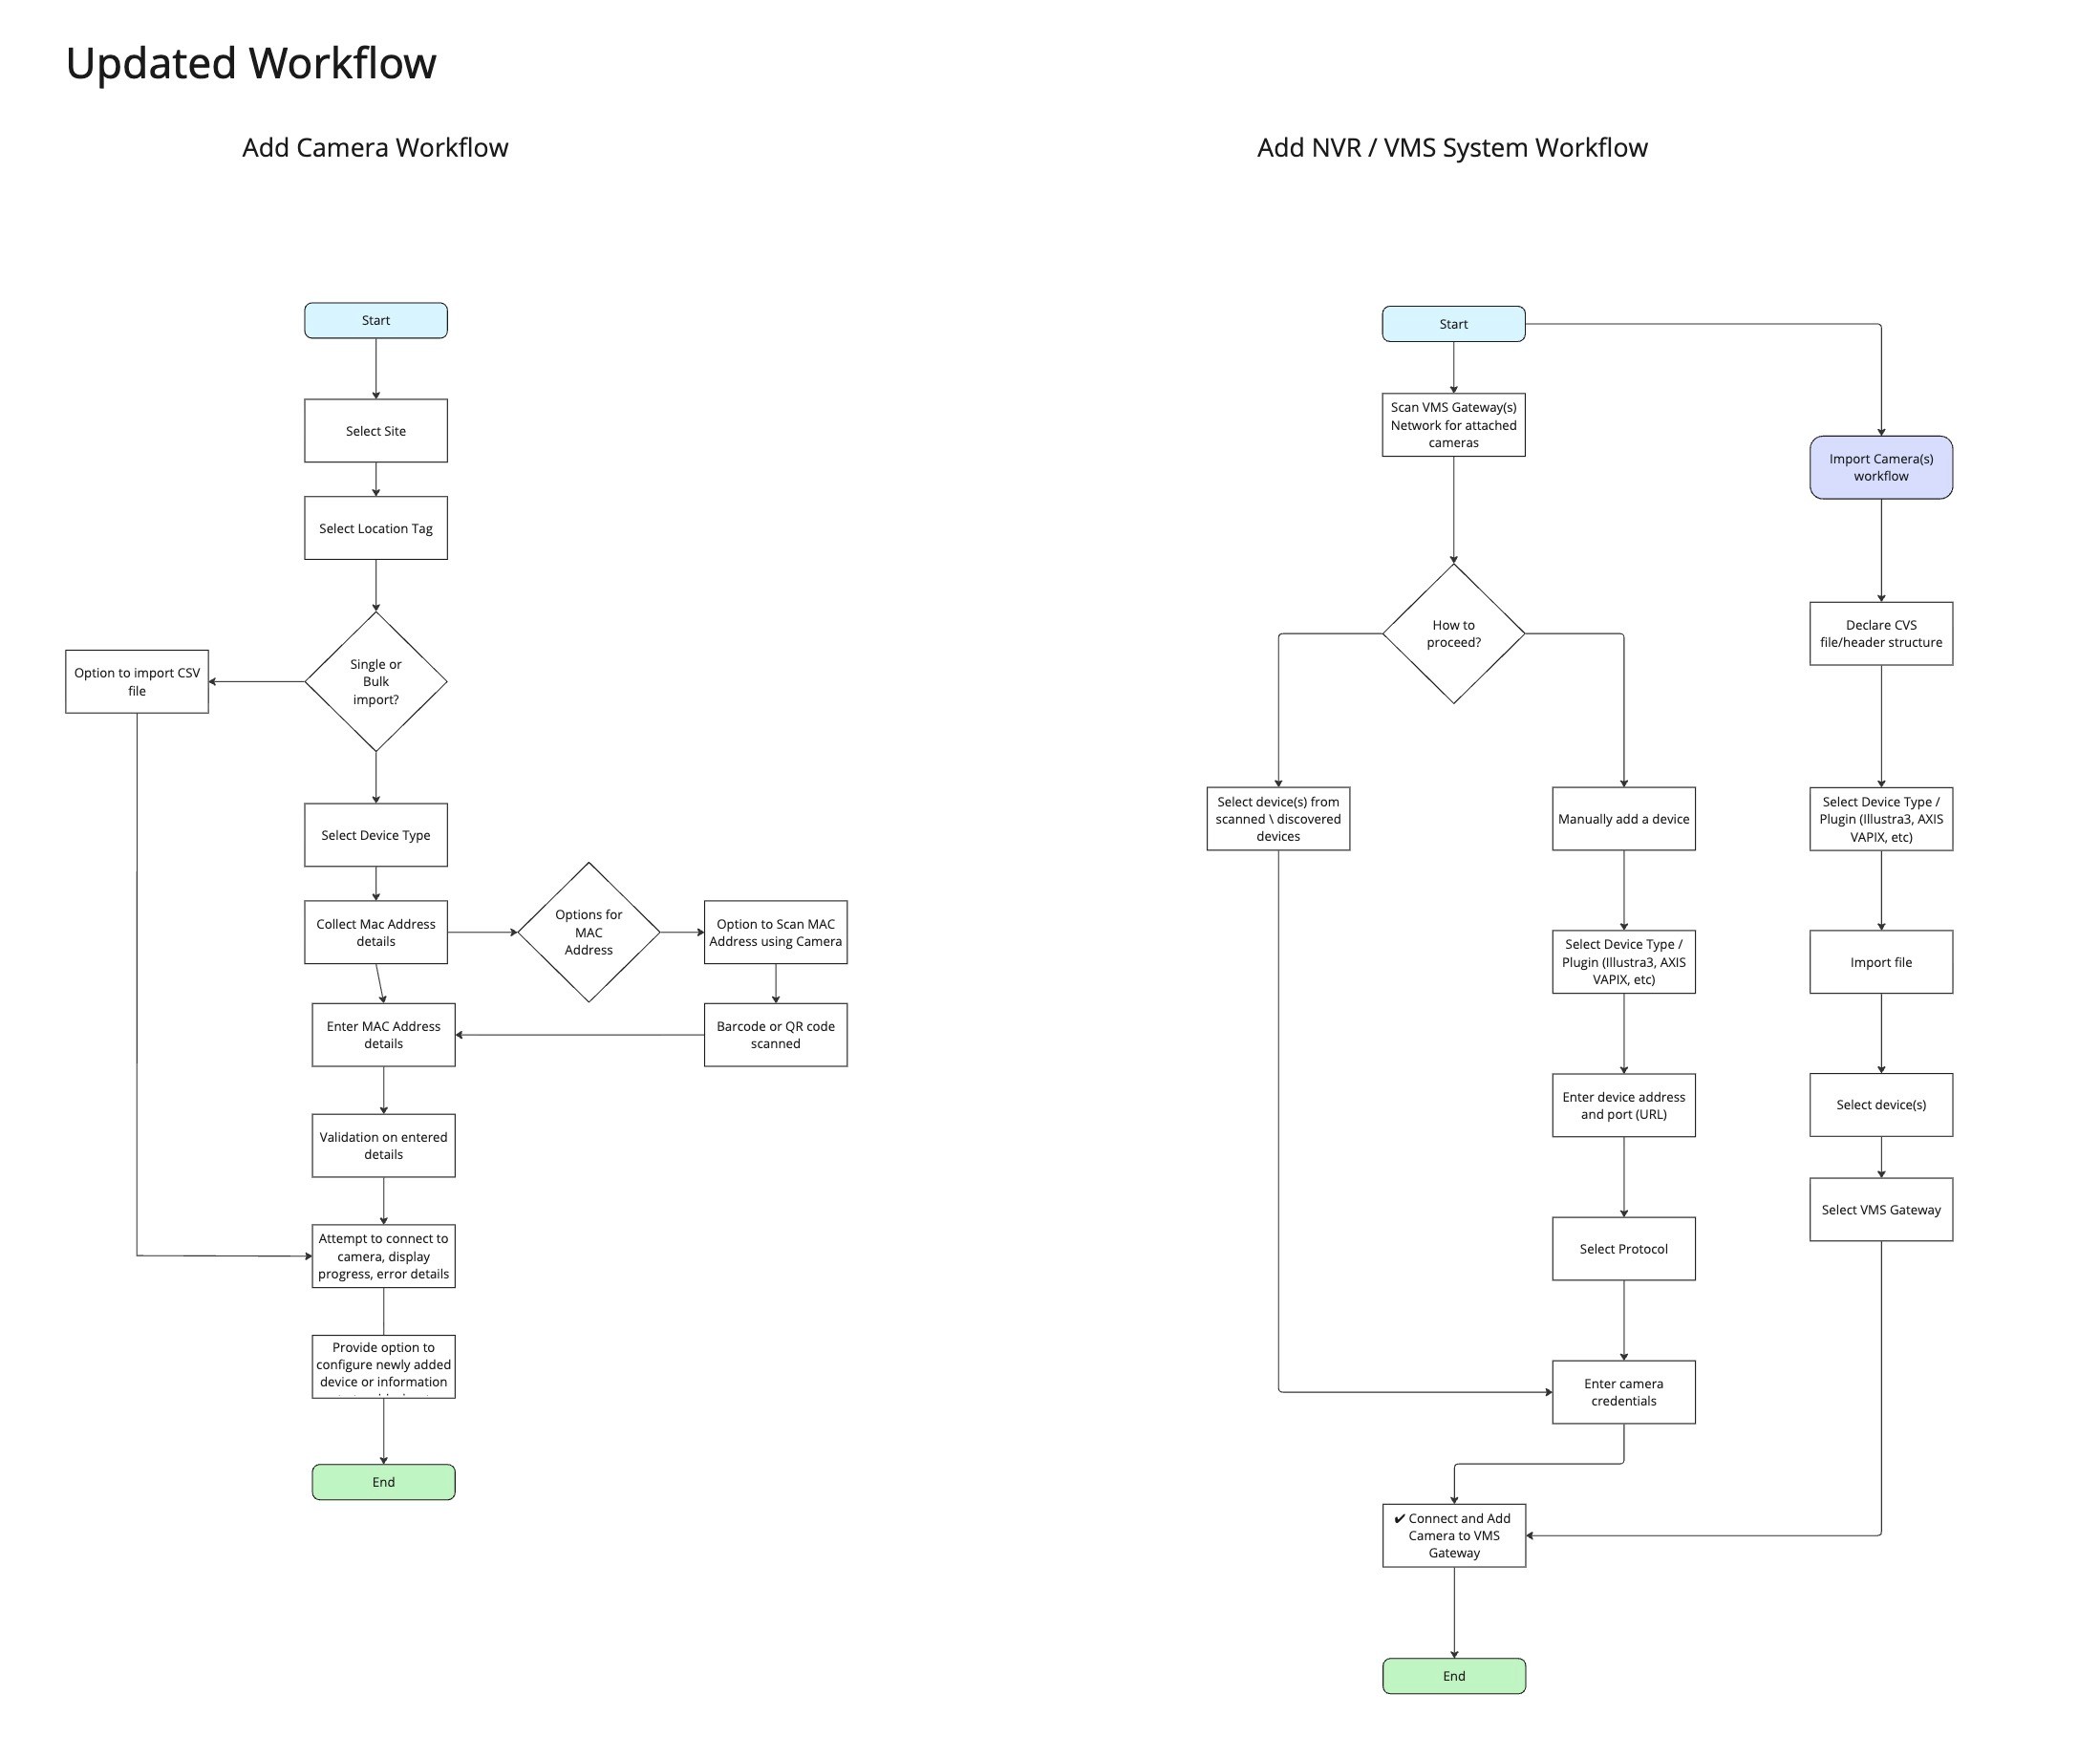
Workflow Simplification
We applied the same system logic to administrative tasks.
Measurable Win: Our redesigned flow, visualized in the high-fidelity prototype, reduced the steps for adding a new device from 7 clicks to 3.
Every module, from Monitoring to Configuration, was designed to follow the same system logic: spatial awareness first, context-rich data second.
Testing & Results
Internal QA & UAT
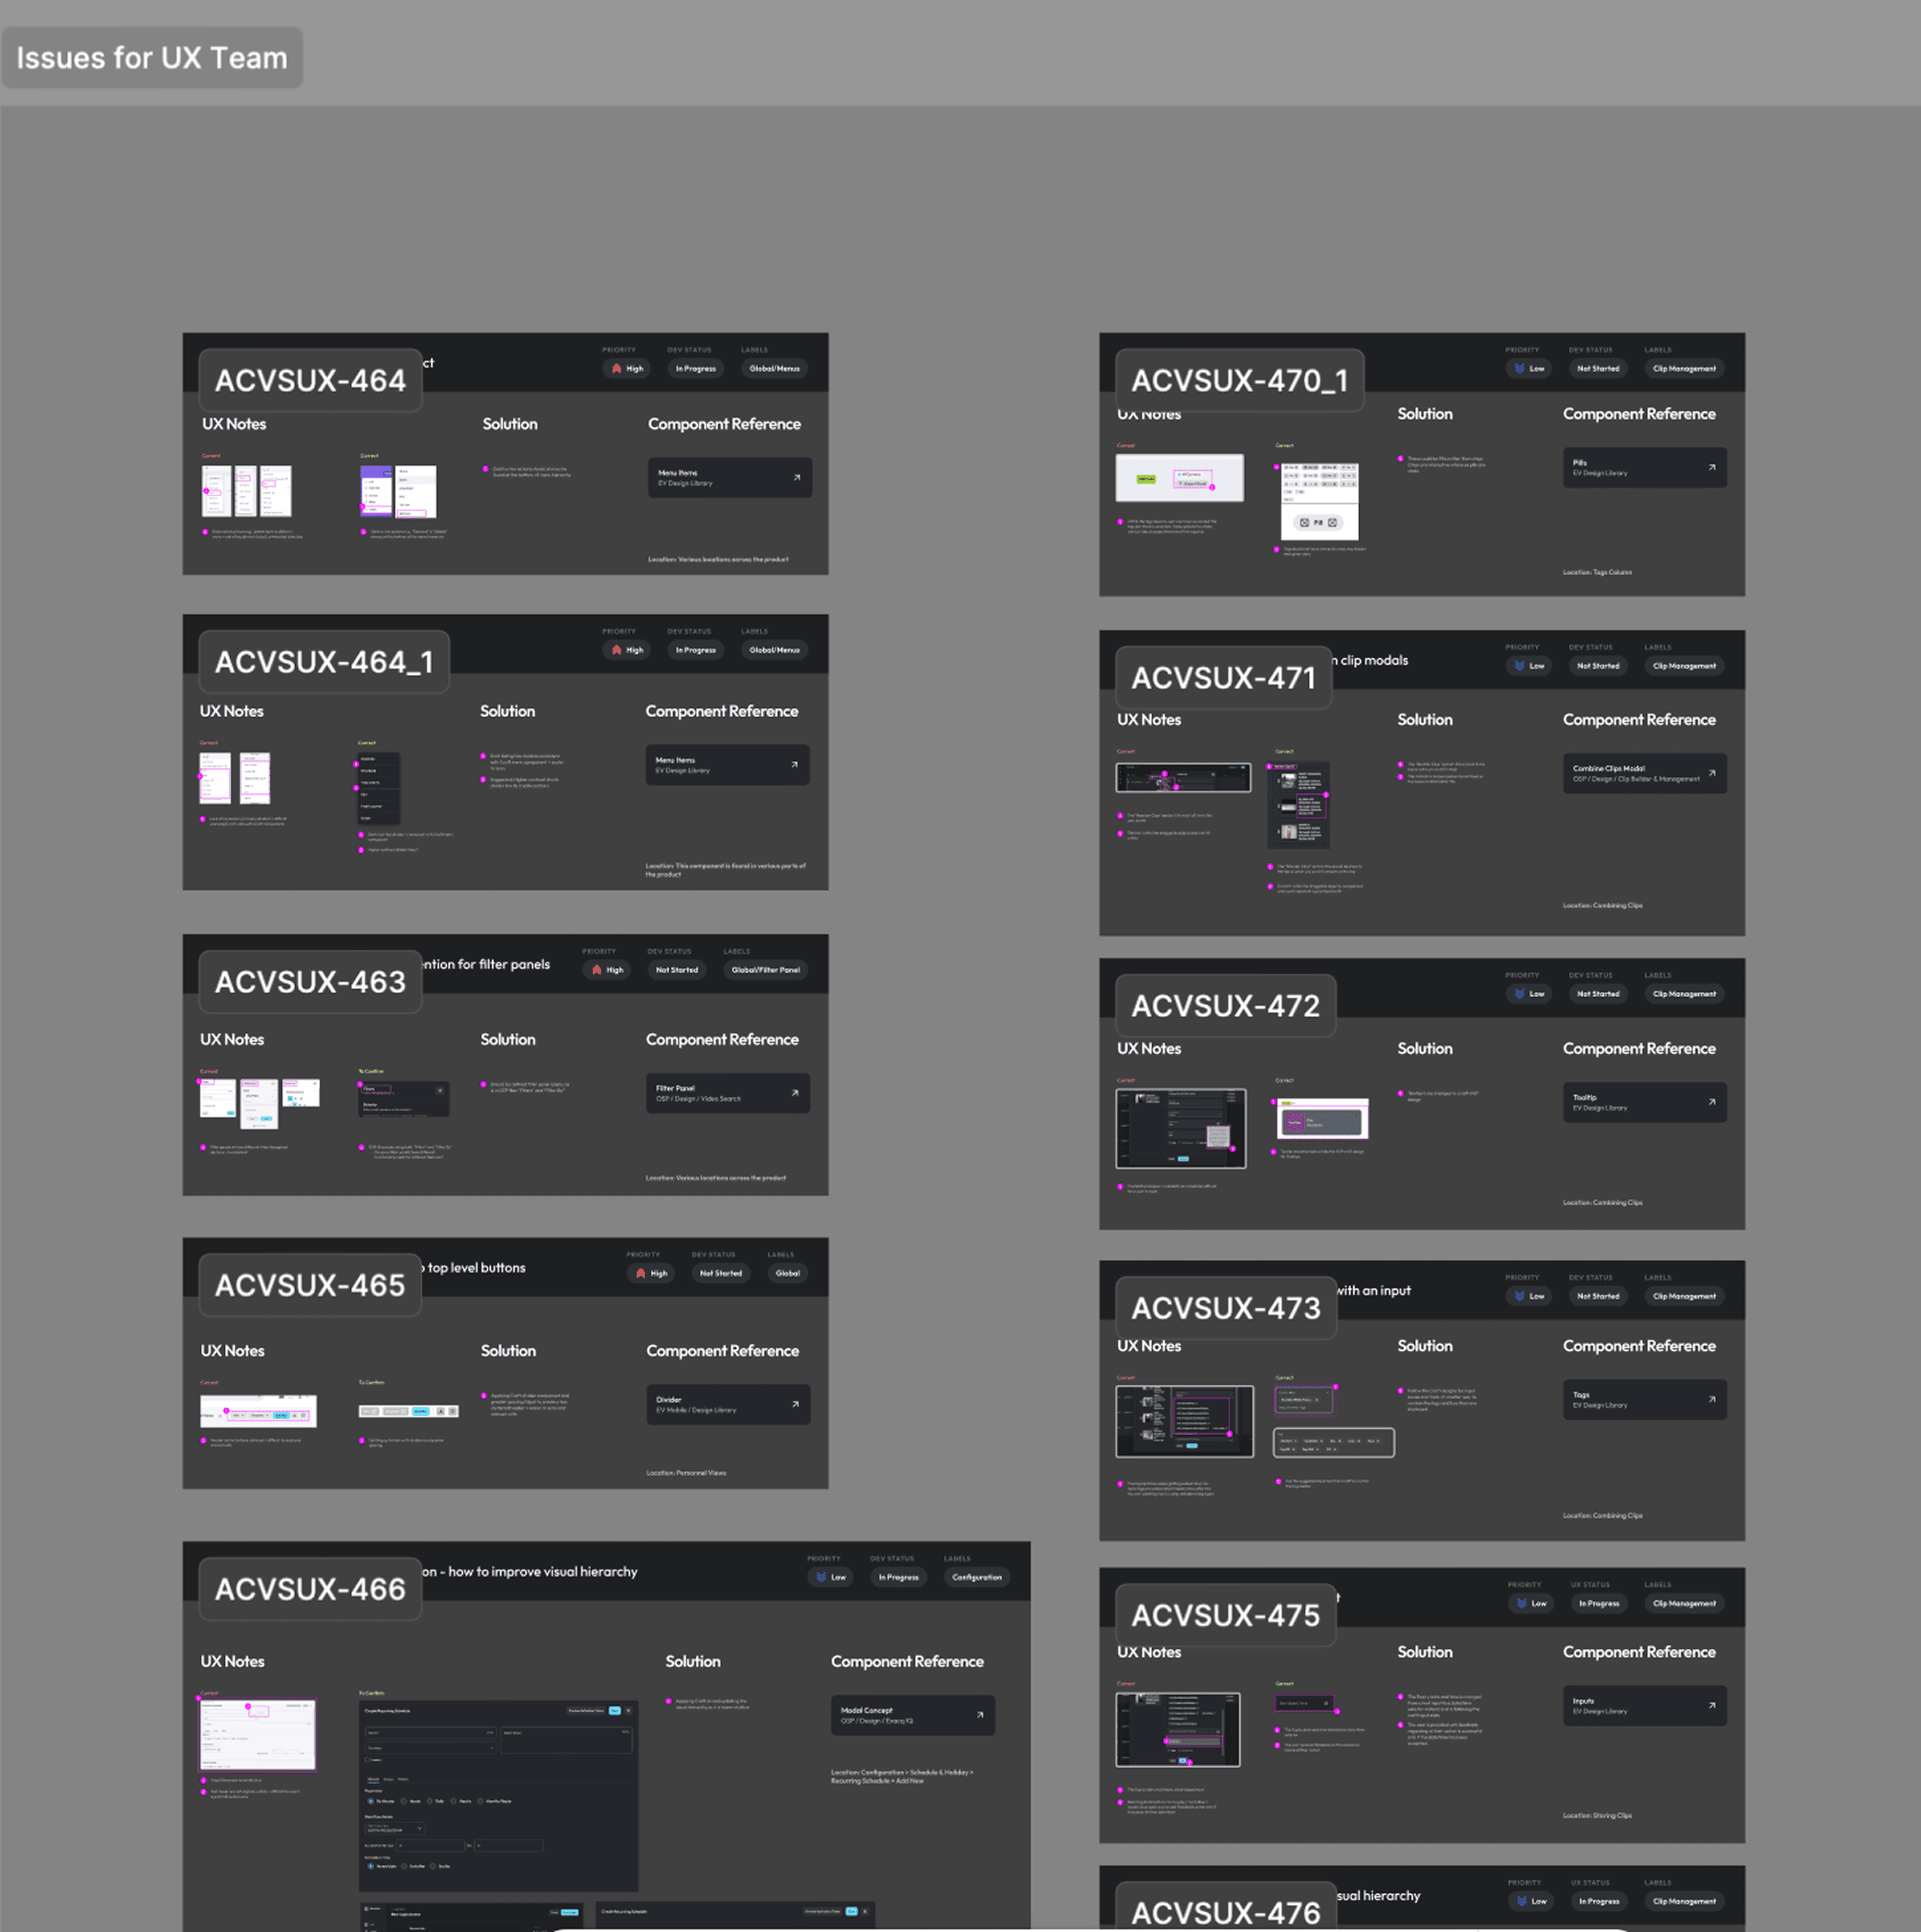
I was hands-on during QA and internal UAT, using a structured design issue triage board to log, prioritize, and resolve usability debt before pilot launch.
This process reduced critical friction points by ~45% prior to deployment.
Behavioral Validation
Beyond metrics, we observed operator behavior during live pilot testing.
In one session:
An operator received a critical alert
Clicked the map pin
Reviewed video
Resolved the event in seconds
He leaned back and asked:
"Okay, what’s next?"
In the legacy system, this moment triggered stress and urgency.
In OSP, it became routine.
70%
Reduction in clicks to handle a typical event.
91%
Faster time-to-acknowledge critical alerts.
45%
Reduction in critical friction points.
Design
Showcasing the tangible design artifacts that transformed chaos into cohesion.
Unified Interface: Before & After
This comparison illustrates the dramatic shift from fragmented legacy applications to the single, intuitive One Security Platform.
Before
Before
Before

After
After
After

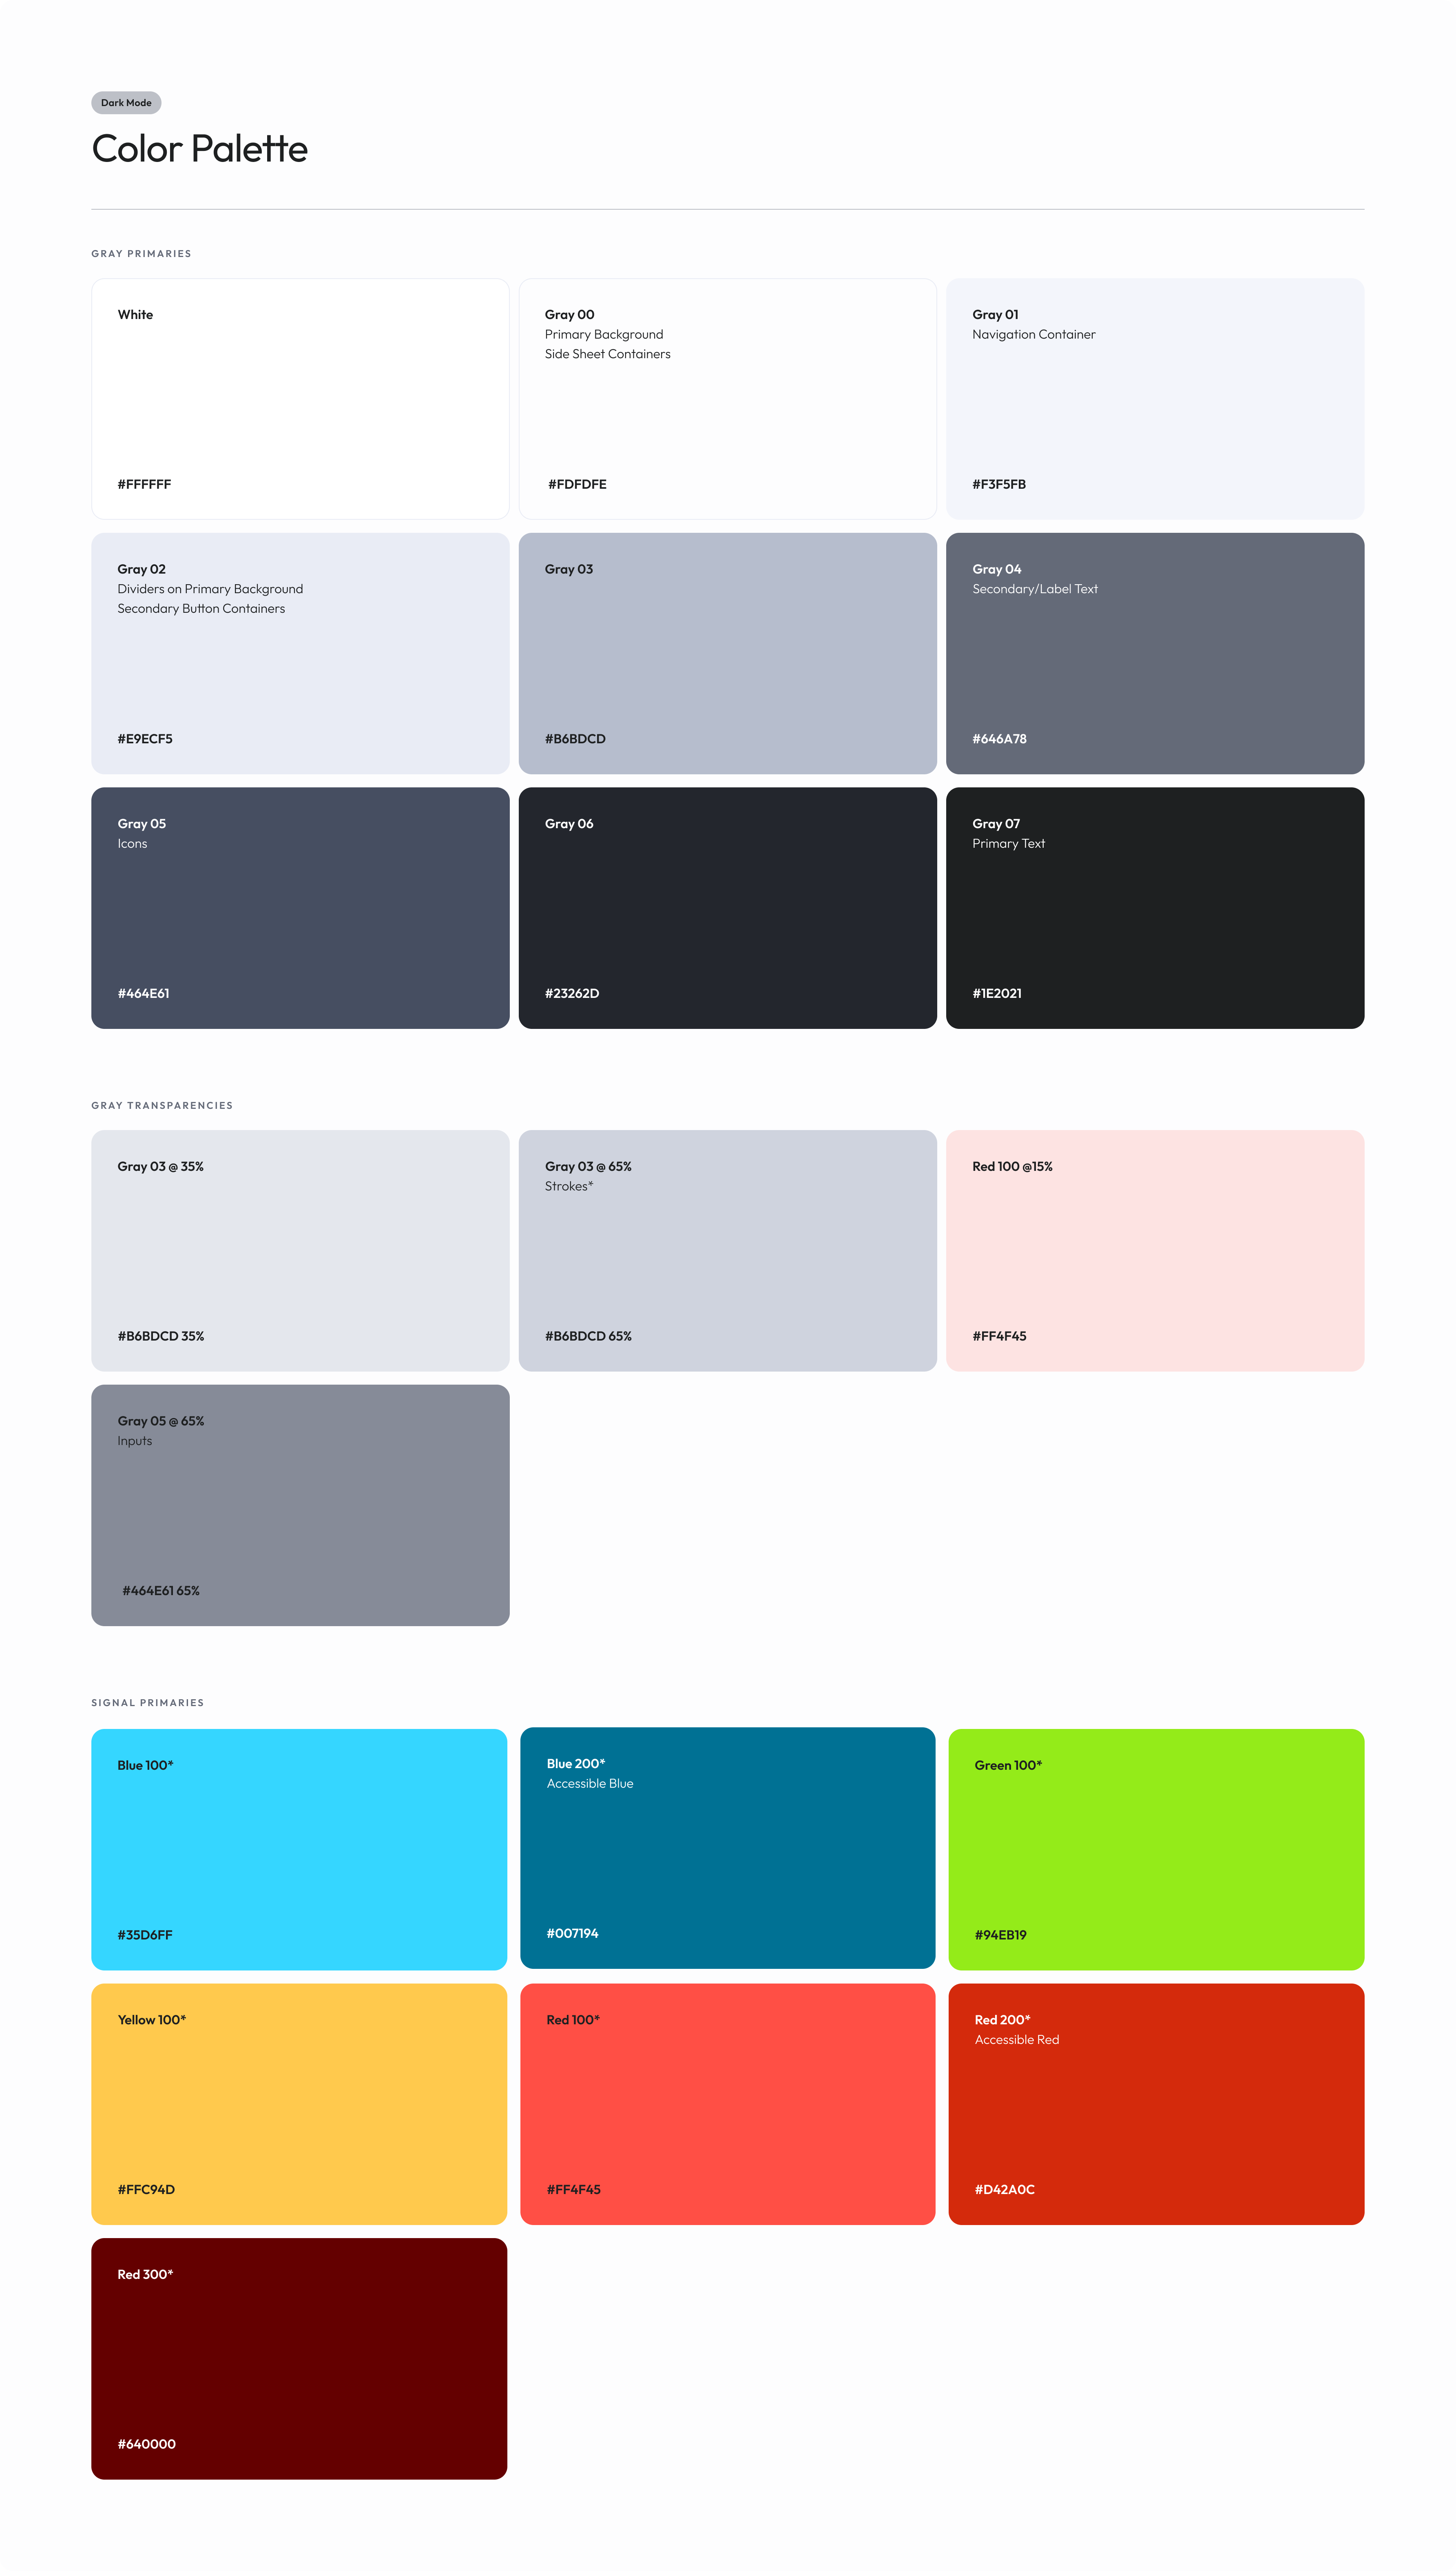
Design System Components & Prototyping
To standardize the experience and ensure scalability, I led the creation of the OSP Design System. It defined the visual language and interaction patterns for the entire platform.
Workflow Evolution
Beyond individual screens, my work focused on the underlying structure. This visual highlights the streamlined path an operator now takes to resolve a critical alert, contrasting it with the previous multi-application journey.

Reflections
Systems Over Screens
This project reinforced that complexity is rarely a UI problem it’s usually a systems problem expressed through the interface.
Alignment Is a Design Skill
The most impactful artifact wasn’t a mockup; it was the system mapping that aligned teams around a shared reality.
Designing for Cognitive Load
When users stop reacting emotionally and start operating calmly, the design is working.
What’s Next
With a unified foundation in place, OSP opens the door to:
Predictive alerts
AI-assisted anomaly detection
Proactive risk mitigation instead of reactive monitoring
Note
Due to the proprietary nature of this enterprise security project and NDAs with Johnson Controls, I’m unable to showcase every detail of the work.
Introduction
Johnson Controls (JCI) operates security systems for large-scale retail and enterprise environments worldwide. Over years of acquisitions, its security operations platform had fragmented into multiple disconnected legacy tools, introducing operational risk during active incidents.
Problem
Operators were effectively the human glue connecting disconnected tools. Responding to a single alert required:
Role: Product Designer
Scope: Systems mapping, interaction architecture, UAT leadership for spatial workflows
>60 Secs
was lost locating the correct camera.
5+ Clicks
were required to navigate from a alert to its indoor map.
~35%
of non-critical alerts were mistakenly escalated.
Research
Research focused on understanding real-world incident response workflows, not idealized task flows.
Key Findings
Operators relied heavily on memory and mental models to navigate sites under stress
Alerts were detached from physical context; operators had to mentally reconstruct spatial relationships
System overload caused high cognitive load and slowed critical decisions
Insight
The core insight emerged from mapping cognitive load and spatial navigation:
"I don’t care where the event came from... I just need to see it, and see it on the map."
Operators think spatially, not in dashboards or tables. Dashboards compress information but do not resolve fragmentation.
Ideation
Early prototypes explored alert-first dashboards with the map as a secondary view. These were rejected because:
They forced operators to switch between multiple context layers
They failed to reduce time-to-action under stress
I explored spatial-first interaction models:
Alerts anchor directly to physical locations
Devices and cameras exist as layered, interactive map elements
Navigation mirrors operator mental models, inspired by retail logistics workflows
Solution
The Map Module became a unified command layer within OSP:
Core Interaction Model
Persistent map-based canvas as primary context
Layer controls replacing tabs
Contextual overlays instead of modals
Before
After
91% Improvement
Alert Response Time: 60s → 9s
70% Improvement
Clicks per Task: 10+ → 3
45% Reduction
Visual Noise: 100% → 55%
Testing & Results
I led UAT design triage for the Map Module:
Testing Insights
Fully populated maps with 10,000+ sensors overwhelmed operators, slowing decision-making
Defined this as visual debt: unnecessary information increasing cognitive load
Iteration
Implemented progressive disclosure: non-critical sensors hidden by default; visibility scales with zoom level and alert severity
Results
91% Improvement
Response Time: 60s → 9s
70% Improvement
Click Reduction: 10+ → 3
45% Reduction
Visual noise: 100% → 55%
Design
Showcasing the tangible design artifacts that transformed chaos into cohesion.
Unified Interface & Design System
Before
After
Design System Components & Prototyping
Workflow Evolution
Beyond individual screens, my work focused on the underlying structure. This visual highlights the streamlined path an operator now takes to resolve a critical alert, contrasting it with the previous multi-application journey.
Reflections
Outcome / Takeaway
Anchoring operator actions to spatial context cut response time by 91%
Reduced clicks and visual noise, improving accuracy and confidence during high-stress incidents
The Map Module became the backbone for platform-wide operational efficiency
Got questions?
I’m always excited to collaborate on innovative and exciting projects!
nayak.pri.work@gmail.com
Phone
6264926162
Got questions?
I’m always excited to collaborate on innovative and exciting projects!
nayak.pri.work@gmail.com
Phone
6264926162